Overview
A complete pricing workspace
One place for the work that decides how much a storage Unit earns.
MaxRev is organized around the way an operator actually works. You start with a dashboard that tells you what needs attention. You move to the queues where Rate changes wait for approval. You check competitors when you need context. You open reports to learn whether last month's changes worked. And you set rules once so you are not making the same decision twice.
Each area below describes what you see on screen and what you can do there.
Dashboard
Executive Dashboard
Your morning view of occupancy, market position and Revenue.
Start the day with the numbers that matter
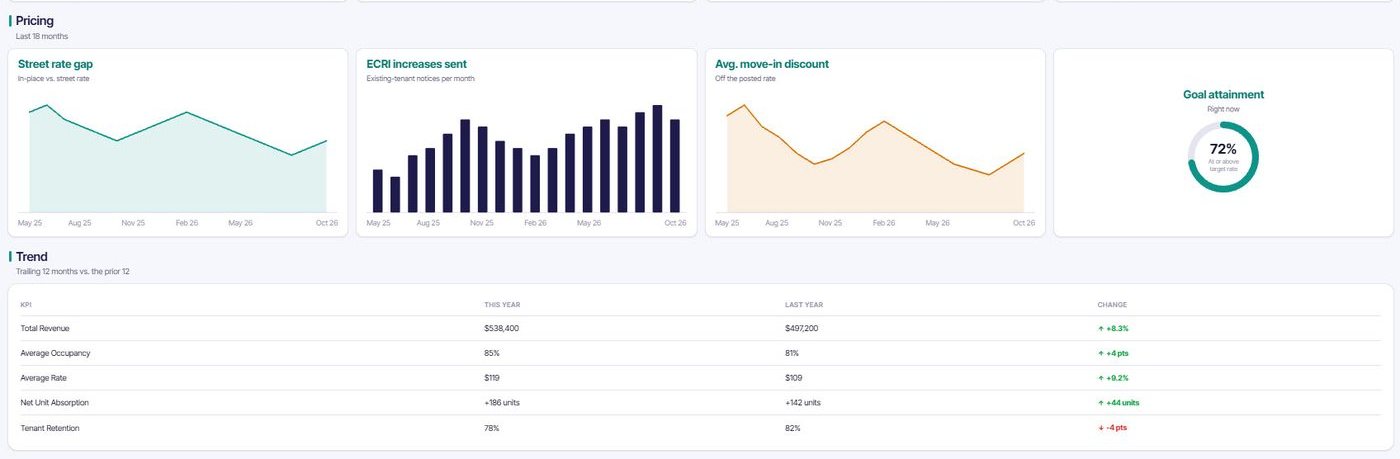
The dashboard opens on four figures: occupancy, market position, Revenue per square foot and the number of changes waiting for your review. Underneath, a market position panel shows your average gap to the market, the gap for each Unit type and any active competitor promotions.
Revenue and demand charts follow, covering occupancy Revenue, Revenue per Unit, move-in and move-out activity and Revenue per square foot against your goal. A trailing 12 month table compares total Revenue, average occupancy, average Rate, net Unit absorption and tenant retention with the prior 12 months.
What you can do
- See occupancy, market position and Revenue per square foot at a glance
- Spot Unit types priced above or below the market
- Track active competitor promotions
- Compare this year with last year on five core measures
- Jump straight into items waiting for review
New tenants
New Tenant Pricing
Street Rates for the Units you are trying to rent.
A suggested street Rate for every Unit type
The New Tenants queue lists each Unit type with its current Rate, the suggested Rate, the number of vacant and occupied Units and occupancy. A confidence tag tells you how sure MaxRev is. High confidence suggestions can be approved quickly. Others deserve a closer look.
Approve the suggestion as it is, adjust it to a number you prefer, or decline it. Approved Rates move to an Approved tab where you can publish immediately or schedule a date and time. Declined and published Rates keep their own tabs, so you always know what happened.
What you can do
- Approve, adjust or decline each suggestion
- Publish now or schedule a date and time
- Undo an approval before it publishes
- Review everything published, with who published it
- Filter by confidence, Unit type and occupancy
Existing tenants
Existing Tenant Pricing
Rate reviews for tenants already in place.
Raise rents with care, one tenant at a time
Over time, long-term tenants drift below your current street Rate. The Existing Tenants view finds them. For each tenant it shows the move-in date, today's street Rate for their Unit, their current Rate, the suggested Rate, the time since their last increase and the notice period required.
Filter by tenure, from one year to more than five years. Open Why this Rate? to see what shaped a suggestion before you approve it. Small, well-timed increases protect retention better than large ones, and the guardrails you set keep every suggestion within a range you accept.
What you can do
- Filter tenants by length of stay
- See the gap between street Rate and in-place Rate
- Open Why this Rate? on any suggestion
- Respect the notice period for each tenant
- Undo an approved increase before it takes effect
See MaxRev with your own Units and Rates
Book a short walkthrough and bring your Facility questions.
Rate Watch
Rate Watch
The history of every Rate change and what shaped it.
A record of every change and the reason for it
Rate Watch is the source of truth for what changed. Tabs separate new tenant Rates, existing tenant increases and changes made in your management software. Open any change to see the old and new Rate, who approved it, when the notice went out, when it takes effect, your goal at the time and the guardrail range that applied.
A breakdown shows how each pricing input contributed to the final number. If someone edits a Rate directly in your management software, Rate Watch notices the mismatch, alerts you and treats the new Rate as the baseline for future recommendations. MaxRev does not try to nudge it back.
What you can do
- Audit every change, including who approved it
- See the goal and guardrails in force at the time
- Catch Rates changed outside MaxRev
- Learn from the breakdown behind each Rate
Competitors
Competitor Intelligence
Context on what nearby Facilities charge and promote.
Know what nearby Facilities charge and promote
The market map places your Facility at the center with distance rings you define, up to ten miles. Nearby Facilities appear on the map and you label each as primary, secondary, tertiary or a sister Facility of your own company. Colors separate REIT-owned, independent and other operators.
Competitor cards compare Rates by Unit size and climate type. The price gap tracker shows where you sit above or below each competitor. The promotion feed lists discounts and special offers detected on tracked competitors, so you can answer a free first month with facts rather than guesses.
What you can do
- Map competitors and label them your way
- Compare Rates by Unit size and climate control
- Track price gaps over time
- Watch competitor promotions as they appear
- Rename tiers and radius labels in Settings
Reports
Reports
Evidence of whether your pricing decisions worked.
Find out whether your pricing worked
Reports cover Revenue, occupancy, move-outs and market position. Revenue reports show the current period against the prior period, Revenue per Unit, a monthly trend and Revenue by Unit type, with a recent Rate changes list. Occupancy reports show current occupancy, Units occupied and average days to fill, with a monthly trend and a view of occupancy after existing tenant increases.
Choose a period of 7 days, 30 days, 90 days or one year. The market position report charts your gap to the market month by month and shows your Rate position by Unit type, so you can see whether your positioning is closing the way you intended.
What you can do
- Compare periods for Revenue and occupancy
- Break Revenue down by Unit type
- Check whether occupancy held after increases
- Chart your position against the market over time
What is inside Reports
Revenue report
Revenue this period against the prior period, Revenue per Unit, a monthly Revenue trend and a breakdown of Revenue by Unit type. Choose 7 days, 30 days, 90 days or one year.
Occupancy report
Current occupancy, Units occupied and average days to fill, with a monthly trend that marks your year average, peak and low. See how occupancy has changed since January.
Move-out report
Review move-out activity over time, so you can see whether move-outs rise after Rate changes and adjust the size or timing of your next increases.
Market position report
Your average gap to the market, how many Unit types are priced above it and how many competitors you track. A monthly chart shows whether the gap is closing.
Rate position by Unit type
Your Rate against the local market average for every Unit type, shown side by side, so you can see which sizes are priced above or below the market today.
Rate changes and occupancy
Every recent Rate change appears with the date and who approved it, next to the occupancy that followed. It is the quickest way to learn whether a change worked.
Revenue by Unit type
See which Unit types earn the most of your Revenue over the period you choose, so you know where small Rate moves matter most.
Choose your period
Switch between 7 days, 30 days, 90 days and one year to look at a quick change or a long trend, without rebuilding the report.
Guardrails
Guardrails
The limits every recommendation must respect.
Set the boundaries once
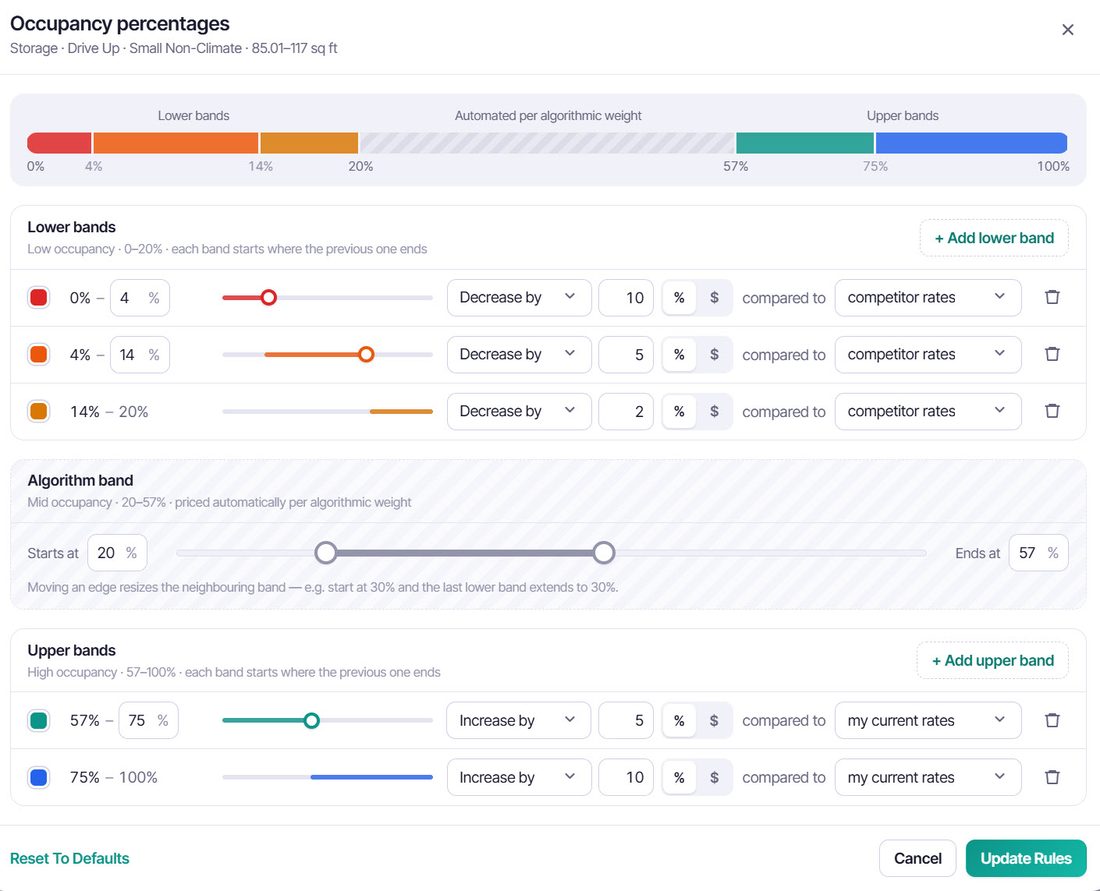
For every Unit size, set a minimum and maximum Rate with a simple slider, and see your current Rate and target next to it. A cap on how much a Rate can move in one step keeps changes gradual.
Occupancy bands let you decide what should happen at low, middle and high occupancy. At low occupancy you might decrease Rates against competitors. At high occupancy you might increase against your current Rates. Between the bands, the pricing model works within your limits.
What you can do
- Set floors and ceilings by Unit size
- Cap the size of any single change
- Define occupancy bands with their own behavior
- Compare against competitor Rates or your own current Rates
Want to see it on your own numbers?
A live demo takes a few minutes and answers most questions.
Rate change rules
Rate Change Rules
Targeted if-then rules for the cases you know best.
Say what should happen, to whom and when
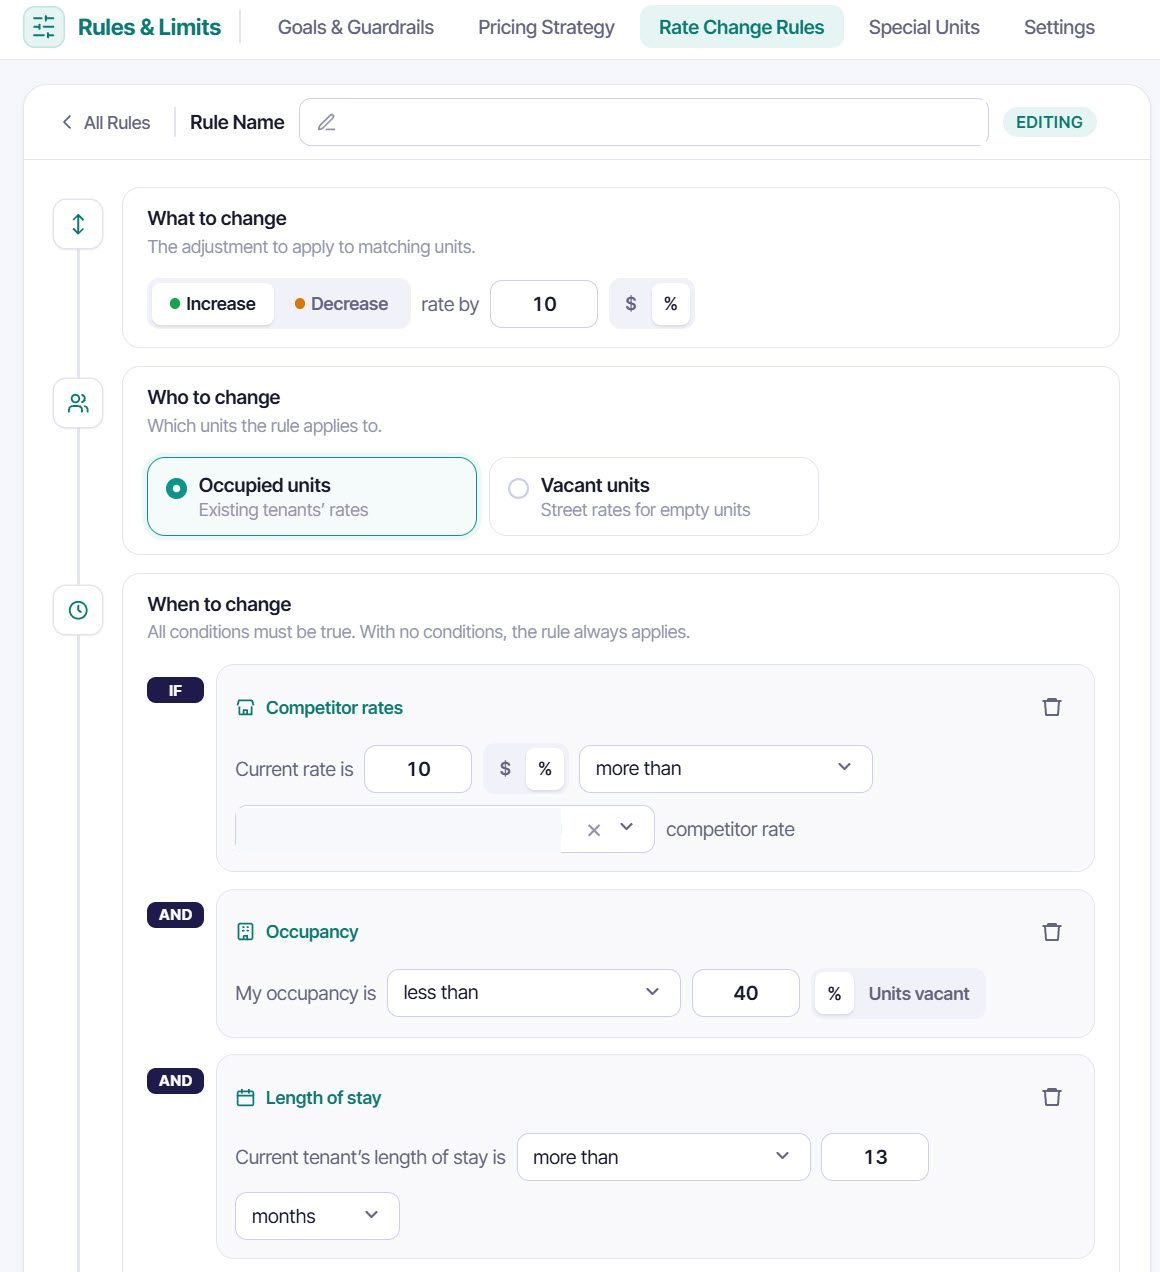
Build a rule in four steps: what to change, who it applies to, when it applies and where. For example, increase Rates for tenants more than 13 months in place when your Rate is more than 10% under competitors and your occupancy is above a level you choose.
Add start and end dates, limit a rule to certain locations, Unit types or amenities, and see a live preview of the rule before you save it.
What you can do
- Increase or decrease by a percent or a dollar amount
- Target occupied Units or vacant Units
- Combine conditions on competitor Rates, occupancy and length of stay
- Preview a rule before you save it
Special Units
Special Units
Premiums, discounts and exclusions for individual Units.
Treat the exceptions as exceptions
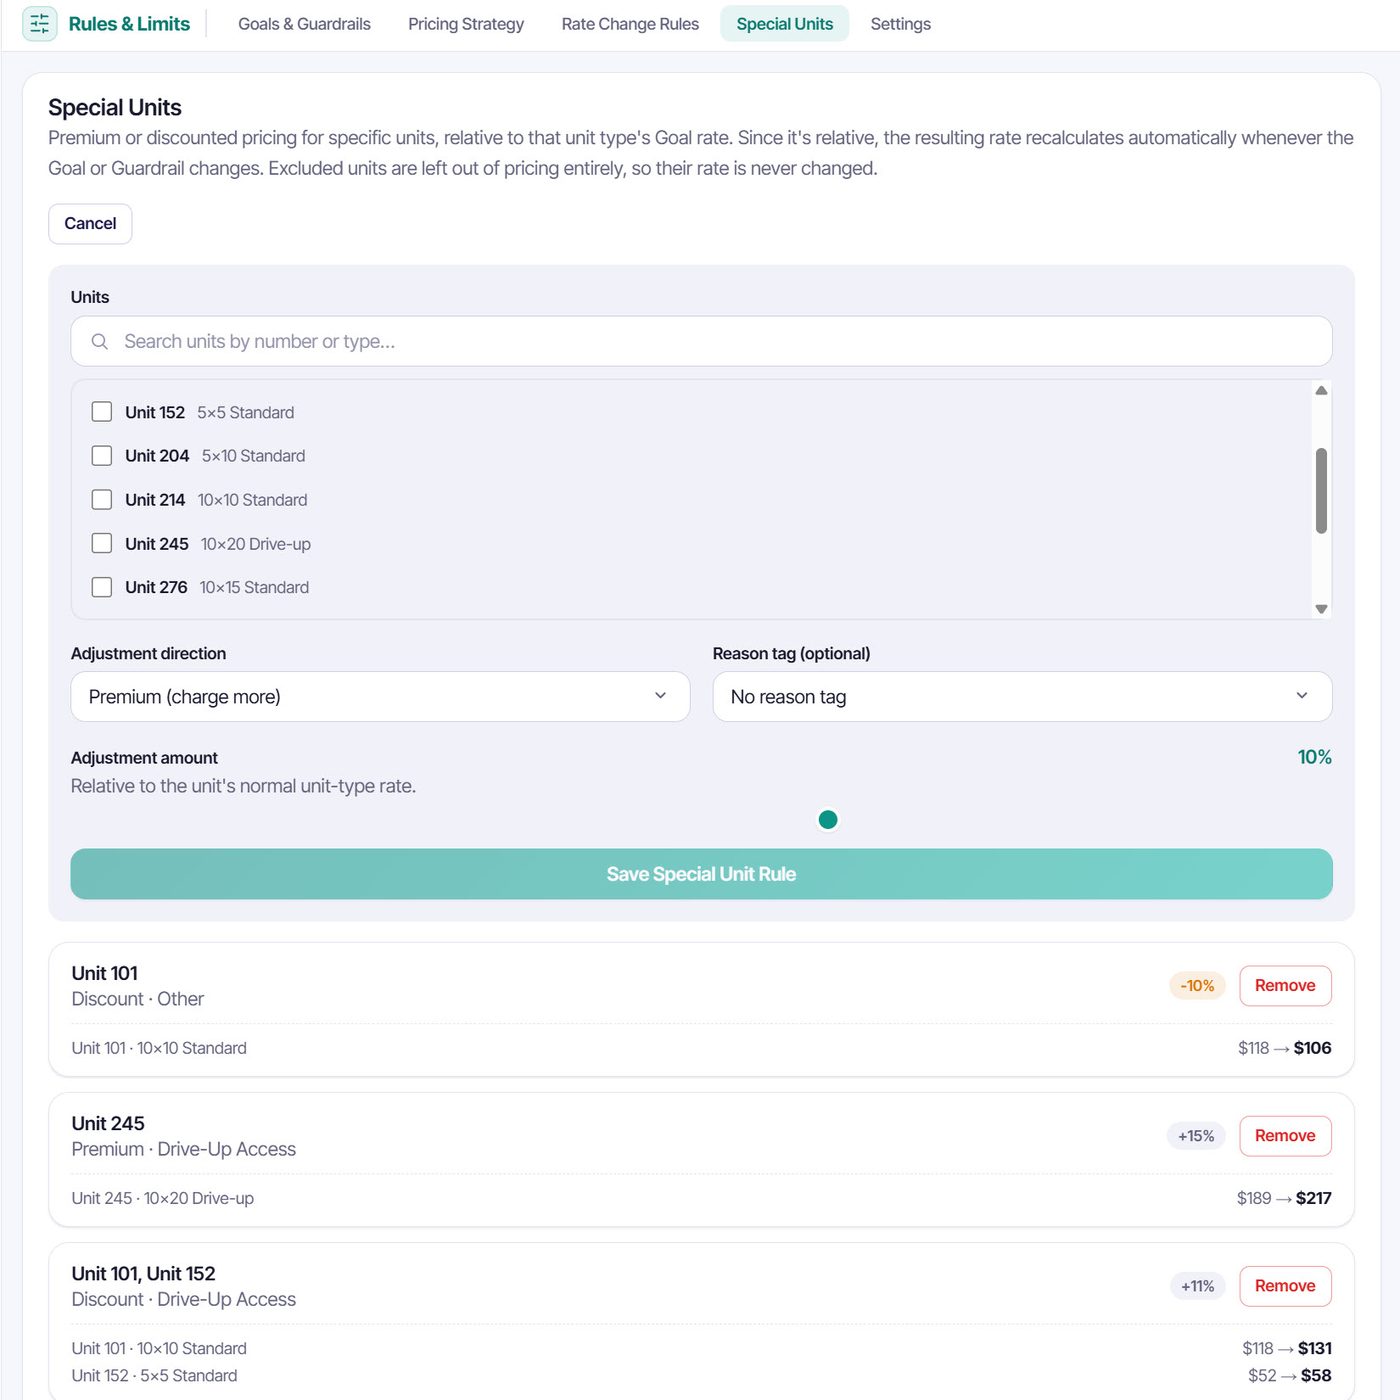
Some Units are not typical. A drive-up Unit may deserve a premium, and a Unit near a loading dock may deserve a discount. Special Unit rules apply a premium or discount relative to the Unit type's goal Rate, so the result recalculates automatically when your goal or guardrails change.
You can also exclude a Unit from pricing entirely, so its Rate is never changed. Add a reason tag so your team remembers why.
What you can do
- Apply a premium or discount to chosen Units
- Exclude Units from automated pricing
- Add a reason tag for each rule
- See the resulting Rate beside the current one
Automation
Automation Controls
You decide how much of the work the software handles.
Decide how much control to hand over
Choose a review mode. Assisted mode applies high confidence recommendations on its own and holds the rest for review. Set the largest increase and decrease allowed in a single change, such as 8% up and 5% down.
Turn on a flag for low confidence recommendations so unclear cases are always routed to you. Choose whether you are notified on every automatic price push and whether you receive a daily summary. Confidence thresholds define how tightly the model's inputs must agree before a suggestion counts as high confidence.
What you can do
- Pick manual approval or Assisted mode
- Cap the size of any single change
- Always review low confidence cases
- Get notified of automatic changes and daily summaries
Settings
Settings for real Portfolios
The setup tools that keep a multi-location business organized.
Connections and integrations
Connect your management software and the competitor Rate feed, see when each last synced and reconnect if needed.
Locations
Add locations one at a time or import a template. Set notice period, total rentable square feet and a Revenue per square foot goal for each. Group locations by region or market.
Unit sizes
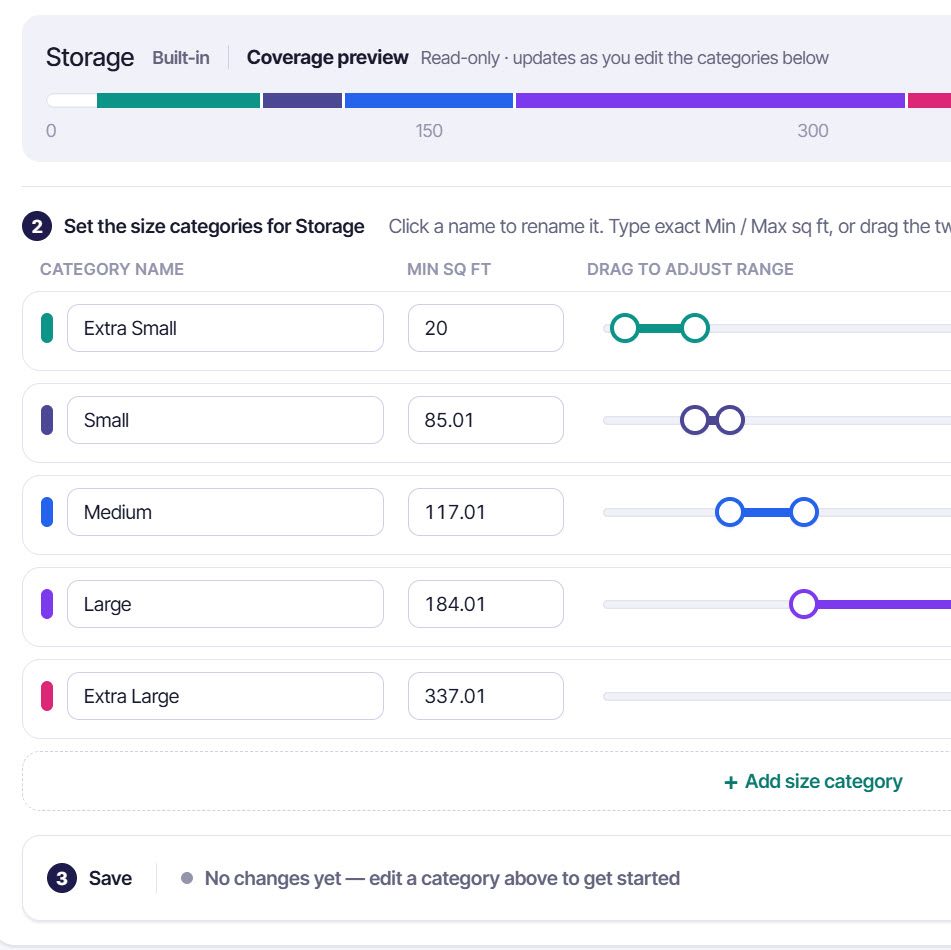
Normalize Units of different dimensions into size categories that you name. Drag the handles or type exact ranges for Storage, Parking or a type you add, such as Cold Storage.
Labels
Rename site tiers and categories in your own wording so reports read the way your team talks.
Users
Invite teammates, resend invitations and deactivate or remove access when roles change.
Billing
See your plan, locations, monthly total, agreement dates, invoices and payment method, and change plans when your needs change.
See what each plan includes
Core, Market and Predictive differ in the data behind your Rates.
View plansBook a Demo